- FII sold in Cash (Net sell 995.32 Crore)
- FII bought in index futures, index options and stock futures but sold in stock options (Net buy 1815.53 Crore)
- DII bought in Cash (Net buy 1107.42 Crore)
- US market ended in Negative.
- Global cues are flat to Negative.
- SGX nifty is Positive as of now.
- Most Active Nifty May Call Option: 5100 and 5000.
- Most Active Nifty May Put Options: 4900 and 5000.
- Advance Decline for the day was 809:498
Current Spot: 4943.95
Pivot: 4966
3DEMA: 4948
7DEMA: 4991
20DEMA: 5087
100DEMA: 5075
RSI (7 days): 31.29
Parabolic SAR: 5049
Supports: 4902 - 4860
Resistance: 5008 - 5072
MP Values Spot: VAH - 5025, POC - 4998, VAL - 4968
MP Values Futures: VAH - 5018, POC - 4998, VAL - 4966
Over all view
Nifty daily chart has formed “DOJI” with long upper shadow which suggests there is a supply at higher levels and one more point to note here is that on Friday nifty has formed “Hammer” with long lower shadow so this two combination suggests that market will experience more volatility in coming days due to abnormal shadow on either side. From last four trading days Nifty is trading below 200 days SMA. We are expecting more volatility with wide range between 4842-5029 levels, and only either side breakout/breakdown provides continuation of trend. Intraday support placed at 4912 - 4880 levels and intraday resistance placed at 4963 - 4987 levels.
Target Nifty
Buy Nifty above 4959 - 4997 - 5065 - 5109 SL - 4952
Sell Nifty below 4924 - 4889 - 4845 - 4777 SL - 4957
Swing Trade
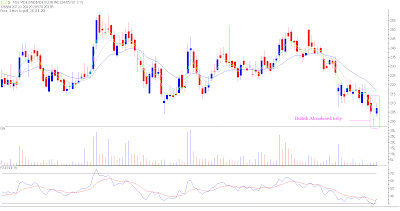
Videocon Ind (207.20)
After making high of 250 on 21 April 2010, stock was trading continuously in down trend. Yesterday stock has formed “Abandoned Baby” a bullish reversal pattern with rising volume on daily chart. Daily momentum indicators after hovering in over sold zone have given positive crossover to signal line. Short term moving averages are also suggesting upward move. Looking at all above technical parameters traders with moderate risk appetite can consider Buy above 209.70 with tight stop loss of 203 on closing basis for a Target of 225.
Bajaj-Auto (2052.45)
After making high of 2223 in mid May 2010, stock has given tired out signal and since then stock is trading with diminishing volume with negative bias, more over yesterday stock has broken ten month old trend line support on daily chart, short term moving averages are showing downward movement and price is trading below 20 days EMA. Daily Momentum indicators as well as weekly RSI also generating sell signal. Looking at all above technical parameters traders with moderate risk appetite can consider Sell below 2050 with tight stop loss of 2075 for a Target of 1995.
Stock Ideas for the Day
Reliance Industries: Buy above 1034 for targets of 1040, 1059, 1072 SL of 1027
Reliance Industries: Sell below 1018 for targets of 1012, 999, 980 SL of 1032
Renuka: Buy above 56.4 for target of 57.2, 58.5 SL 55.4
Surya Roshni: Buy above 86.5 for target of 88.5, 91 SL 85.5
Positional Call
Zydus Wellness: Buy above 494 for target of 530 SL 473 (One Week)
Insecticid: Buy above 160 for target of 180 SL 156 (One Month)
Use strict STOP LOSS in each and every trade in this kind of volatile market and Trade at your own risk.
Thanks and Regards
S&P Wealth Creators
Call 09831497250 or mail us @ S&P Wealth Creators with your Name and Mobile No. for subscription offer of intraday calls during Market hours.


0 comments:
Post a Comment
Please leave your comments here...